Still have questions? Leave a comment
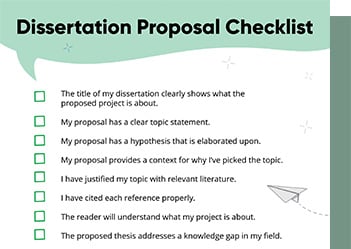
Checklist: Dissertation Proposal
Enter your email id to get the downloadable right in your inbox!
[contact-form-7 id="12425" title="Checklist: Dissertation Proposal"]
Examples: Edited Papers
Enter your email id to get the downloadable right in your inbox!
[contact-form-7 id="12426" title="Examples: Edited Papers"]Need
Editing and
Proofreading Services?

Independent vs. Dependent Variables | Meaning & Examples
 May 24, 2024
 7
min read
7
min read
To carry out experimental research, it is crucial to understand the difference between independent vs. dependent variables. In this article, we’ll define dependent variables and independent variables and describe their types. With this, we’ve explained how to remember the difference between independent and dependent variables.
Want to know the best method to depict independent and dependent variables? We’ve mentioned how to represent these variables. With this, we’ve also added examples of independent and dependent variables. So let’s begin!
A variable is a factor, feature, trait, or property that is studied and investigated for a specific purpose. Now, let’s quickly understand an independent variable definition.
What is an independent variable?
An independent variable is a variable that is not affected by any other variables within the research. It is the factor that researchers think is the cause of a specific condition or situation. It’s essential to define the independent variable for testing the research paper hypothesis. Here is an example of an independent variable to understand better!
In a study to analyze the impact of sleep on academic performance, sleep is the independent variable that will be controlled.
To understand what is the difference between independent and dependent variables, let’s understand the above example in detail!
| Independent variable | Dependent variable |
|---|---|
| Hours of sleep- (4 hours) | Negative impact on academic performance |
| Hours of sleep- (6 hours) | Less impact on academic performance |
| Hours of sleep- (8 hours) | Positive impact on academic performance |
To clarify the independent variable meaning further, let’s quickly see its types. We’ve also included a practical independent variable example for every type.
Types of independent variables
1. Manipulated variables
Manipulated variables are those variables that can be directly controlled by researchers during an experiment. To minimize biases, they are randomly assigned to participants. They usually have two or more levels of groups.
In a study on plant growth, a botanist can manipulate the intensity of light that plants receive. The intensity of light is the independent variable in this study. Some plants might be grown under low light conditions, others under medium light, and another group under high light.
2. Subject variables
Subject variables are those variables that aren’t directly controlled but are used for categorizing participants into groups based on common characteristics. They can include demographic factors, psychological traits, or physiological characteristics. Gender, race, and ethnicity are some types of subject variables.
In a study that analyzes customer loyalty to a popular brand, the participants can be grouped according to different age groups 17-30, 31-50, 51- 70).
Here ‘age’ is the subject variable.
3. Predictor variables
Predictor variables are those that help to predict or explain any impact on the dependent variable. It’s not manipulated by the researcher, only controlled and observed.
In a study that observes the impact of income level on consumer habits and spending, “income” is the predictor variable. By analyzing the income level (low, medium, and high), it is possible to predict the consumer’s spending behavior.
4. Extraneous variables
Extraneous variables are those variables that are not the subject of the current research but are controlled so that they don’t affect the outcome. Browse through an example of an independent variable that is extraneous!
In a study that analyzes the effects of aromatic substances on memory recall, while an aromatic substance like lavender oil is the independent variable, the room temperature is an extraneous variable that could affect the participants’ comfort level and concentration. Hence, the researcher should monitor the room temperature and keep it the same across all rooms where this study is conducted.
Independent variables can also be differentiated into broad categories such as qualitative and quantitative variables. While qualitative variables can be measured without numeric values (e.g. happiness), quantitative variables can be calculated in numeric units (e.g. age, income).
Now let’s see a simple dependent variable definition.
What are dependent variables?
A dependent variable is a factor that changes due to the manipulation of the independent variable. It’s the response and effect due to the influence of the independent variable. It’s observed and measured by researchers. Let’s see an example to understand better!
In a research study that analyzes the impact of teaching methods on learning, teaching methods like flipped classrooms and project-based learning are independent variables. The impact on students is the dependent variable. This impact can be measured through test scores and grades.
To understand this definition of dependent variables better, let’s explore its types. We’ve also added a practical dependent variable example for every type!
Types of dependent variables
1. Outcome variables
The variable being analyzed by the researchers to understand the impact of the independent variable is known as the outcome variable. They represent the result which you wish to determine through your study. Browse through the
In a study of the effect of air pollutants on respiratory health, the level of pollutants released are independent variables. The number of incidents of respiratory issues in healthcare centers and their severity is the outcome variable.
2. Response variable
The variable that shows the behavior or response due to the modification of another variable is known as the response variable. The effect is measured immediately after the manipulation of the dependent variable.
In a study that analyzes the impact of different marketing techniques on sales, the independent variable is the intensity of the campaigns performed (no of hours, days, and weeks). The response from customers and the sales figures after the implementation of marketing techniques are the response variables.
3. Continuous variables
Continuous variables are those variables that take any value within a specific, defined range. They can be measured in fractional and decimal values. Height, weight, time, temperature, speed, distance, and volume are some kinds of continuous variables. Let’s see an example of a continuous dependent variable in a research study:
In a research study analyzing the effects of a low-carbohydrate diet on weight loss, weight is the continuous dependent variable that will be measured. Here, the weight will be measured in kilograms.
4. Categorical variables
Variables that represent groups and categories are known as categorical variables. These variables do not have a specific numerical value. They describe characteristics or attributes of categories or groups.
In a research study observing the effect of a new treatment on patients, the types of treatment are the independent variables. The impact on the patients is the dependent variable. This outcome can also be measured using categoric variables like health improved, with no change or worsened.
The above examples clearly show the difference between dependent vs. independent variables. Before seeing how to visually represent variables, let’s quickly understand the steps for identifying dependent and dependent variables!
- Analyze the variable which is thought to be the cause of a condition.
- Determine if the variable will be manipulated. (If yes, it’s your independent variable!)
- Predict the possible effects of manipulating the independent variable.
- Define the outcome that will be measured. (This helps to understand your dependent variable)
Now let’s see how they can be visually represented.
Visually depicting independent and dependent variables
Depending on your research topic, you can portray dependent and independent variables using the following methods:
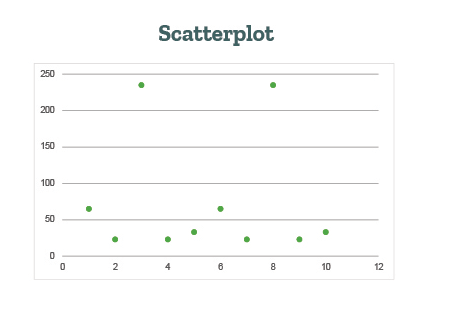
1. Scatterplot
This format is used where both, the independent and dependent variables are continuous. They show the relation between variables such as positive, negative, or zero correlation.
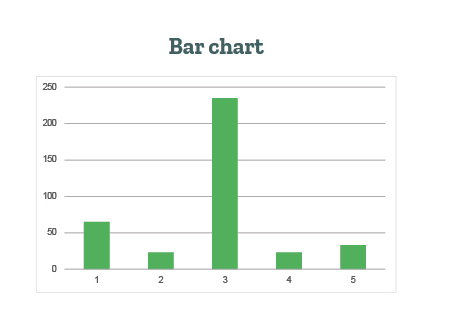
2. Bar chart
This format is used when the independent variable is categorical and the dependent variable is continuous or categorical. Bar charts are effective for comparing values across different categories.
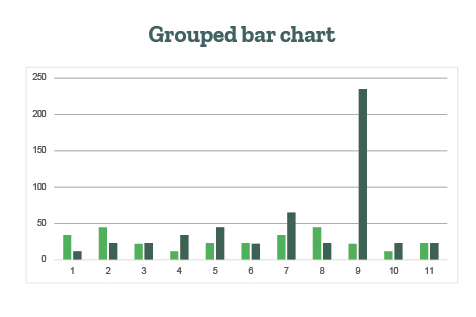
3. Grouped bar chart
Grouped bar charts are used when there are two categorical independent variables and one continuous or categorical dependent variable. The primary independent variable categories are represented by groups of bars, while the secondary independent variable categories are represented by different colors or patterns within each group. This helps to illustrate the difference between dependent and independent variables.
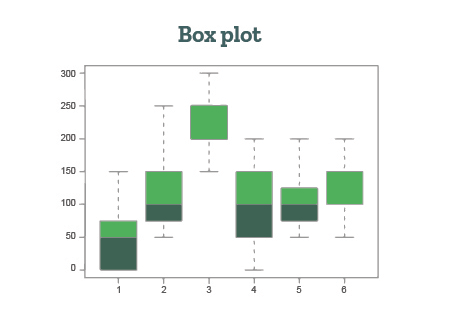
4. Box plot
It is used when the independent variable is categorical and the dependent variable is continuous. The independent variable categories are represented by separate box plots. Box plots are useful for comparing the distribution and variability of the dependent variable across different categories.
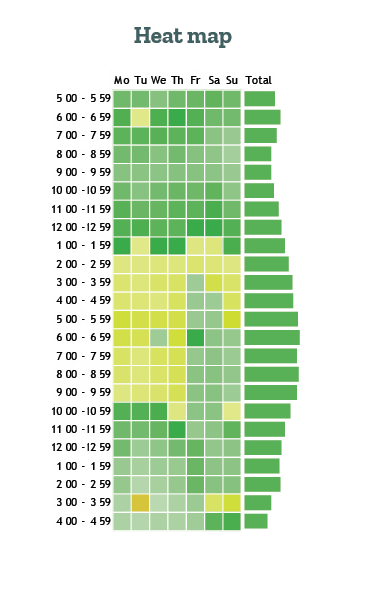
5. Heat map
It is used when both the independent and dependent variables are categorical. The independent variable categories are represented by rows, and the dependent variable categories are represented by columns. Heatmaps are effective for visualizing the relationship between two categorical variables and identifying patterns.
You can bookmark this article to browse through independent and dependent variable examples if required. Now that you know what’s an independent variable vs. a dependent variable, you can determine the research methodology. Once you complete your academic paper, the next step will be to edit it. As experts in editing and proofreading services, we’d love to help you perfect your paper!
Here are some articles you might find interesting:
Frequently Asked Questions